SOLIDWORKS Design Insight Plot: Locations of Max Loading
When running Static Studies, there are many useful plots that can give a wide variety of information. One of these plots is the Design Intent plot and sometimes known as a “load path” plot. This plot is designed to show the areas with higher loading. Using this plot, it can be determined what areas could potentially be reduced to save on material or weight. It can also be used to identify what areas might need to be “beefed up,” but the Factor of Safety plot and the Fatigue Check plot are geared more to that use.
By default in SOLIDWORKS, the Design Insight plot can be found in three locations. First, like other plots the Design Insight plot can be found by right-clicking on the Results folder and selecting Define Design Insight Plot. It can also be found in the Simulation pull-down menu under Plot Results. Last, it can be found on the Simulation Tab as shown below.
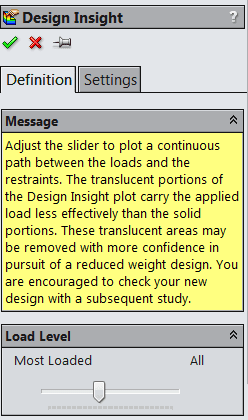
Once this plot is activated, the following PropertyManager is given.
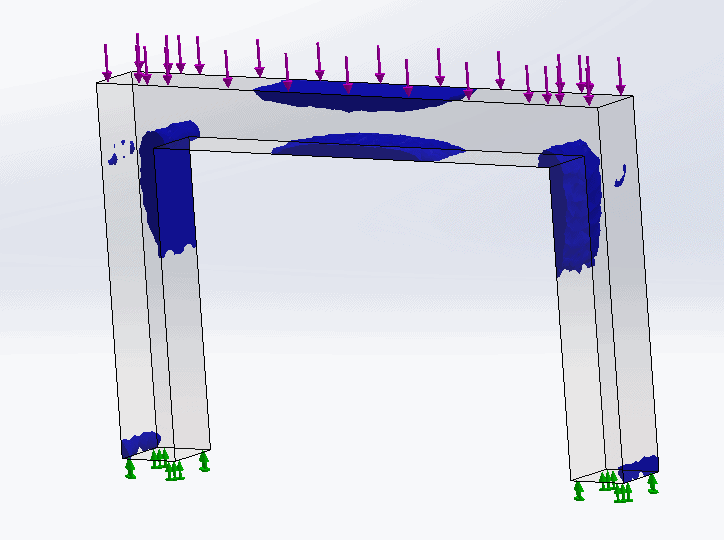
If the Load Level is set all the way to the right at “All” then the entire model will appear blue. The further to the left the slider is set, the areas of lesser loading will become translucent. Below is an example.
Like all plots, this plot will not be needed for every study, but it is one more tool in the toolbox in creating the best design.
Chad Whitbeck, CSWP
Applications Engineer, CATI

 Blog
Blog 

